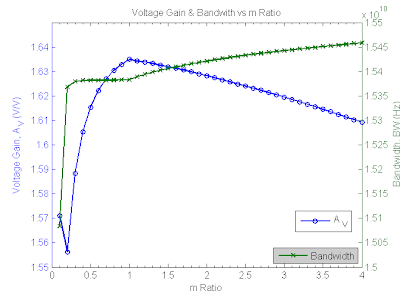
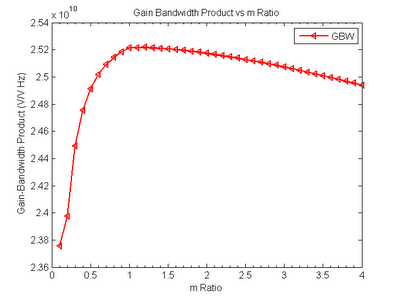
Plotyy function is used to perform the task. Besides this, it also shows how to set/configure the 2 y-axes by using "set" function. In this example, it sets the Y limit range, auto Y tick, line style, marker, line width, title.


clc %clear working screen
clear %clear all memory
close %close all figure
format short eng
%format short e %format short g
linewidth=1.5; %set line width of a plot
file = 'fixed_Iden_nonlinear1V_5mA_w10u_2.csv';
temp = load(file, '-ascii'); %load a file with data
%[row,col]=size(temp) ; %find row & col size
%retrieve data
ntime = temp(:, 1);
Iden = temp(:, 2);
Av = temp(:, 3);
BW = temp(:, 4);
GBW = temp(:, 5);
Vsw = temp(:, 6);
plotyy(ntime, Av, ntime, BW) %plot with two y axes
[AX,Y1,Y2]=plotyy(ntime, Av, ntime, BW,'plot') ;
%Property_AX=get(AX(1)) %to check property of AX
set(AX(1),'XMinorTick', 'on') %enable minor tick on x-axis
set(AX(1),'YLim',[1.55 1.65]) % Change Y1 axis limit range
set(AX(1),'YTickMode','auto') % Change YTick become auto
set(AX(2),'YTickMode','auto') % Change YTick become auto
set(Y1,'LineStyle','-', 'Marker','o', 'LineWidth', linewidth )
set(Y2,'LineStyle','-', 'Marker','x', 'LineWidth', linewidth )
%set(Y1,'LineStyle','-', 'Marker','o', 'Color','b', 'LineWidth', linewidth ) %set(Y2,'LineStyle','-', 'Marker','x', 'Color','g', 'LineWidth', linewidth )
title('Voltage Gain & Bandwith vs m Ratio');
set(get(AX(1),'Ylabel'),'String','Voltage Gain, A _V (V/V)')
set(get(AX(2),'Ylabel'),'String','Bandwidth, BW (Hz)')
xlabel('m Ratio');
legend( Y1,'A _V', 'Location','Best')
legend( Y2,'Bandwidth', 'Location','SouthEast')
figure
plot(ntime, GBW,'-
%Plot property put after all plots
title('Gain Bandwidth Product vs m Ratio');
set(gca,'XMinorTick', 'on')
ylabel('Gain-Bandwidth Product (V/V Hz)');
xlabel('m Ratio');
legend('GBW')
--------------------------------------------------------------------
No comments:
Post a Comment