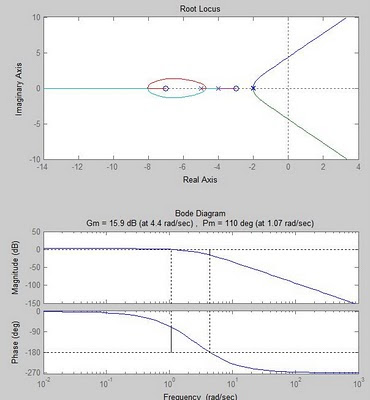
Here is a simple Matlab code for control theory like bode plot, root locus, and transfer function. You could either use symbolic method, which using 's' as Laplace symbol or directly key in into vector form (easier).
------------------------------------------------------------------------------------------
clc
clear
syms s %construct symbolic object
F1=20*(s+3)*(s+7)/[(s+5)*(s+2)^2];
display('F1(s)=')
pretty(F1)
F2=1/[s^2+8*s+16]
display('F2(s)=')
pretty(F2)
F3=F1*F2;
display('F3(s)=F1(s)*F2(s)=')
pretty(F3)
f=ilaplace(F3);
display('Inverse Laplace for F3(s):')
pretty(f)
[num,den]=numden(F3); %extract symbolic numerator and denominator
num=sym2poly(num); %form vector for numerator
den=sym2poly(den); %form vector for denominator
Gtf=tf(num,den) %G(s) in polynomial form
Gzpk=zpk(Gtf) %convert G(s) to factored form
subplot(2,1,1)
rlocus(Gzpk) %root locus plot
%sgrid %turn on grid for damping ratio
subplot(2,1,2)
%bode(Gzpk) %bode plot
margin(Gzpk) %find and plot phase & gain margin
-----------------------Result----------------------------------------
F1(s)=
(20 s + 60) (s + 7)
-------------------
2
(s + 5) (s + 2)
F2(s)=
1
-------------
2
s + 8 s + 16
F3(s)=F1(s)*F2(s)=
(20 s + 60) (s + 7)
--------------------------------
2 2
(s + 5) (s + 2) (s + 8 s + 16)
Inverse Laplace for F3(s):
- 80/9 exp(-5 t) + (25/3 t - 10/9) exp(-2 t) + (-15 t + 10) exp(-4 t)
Transfer function:
20 s^2 + 200 s + 420
----------------------------------------------
s^5 + 17 s^4 + 112 s^3 + 356 s^2 + 544 s + 320
Zero/pole/gain:
20 (s+7) (s+3)
---------------------
(s+5) (s+4)^2 (s+2)^2
%%%%%%%%%%%%%%%%%
the red color indicates display problem when posting them in html (displacement)
%%%%%%%%%%%%%%%%%%
-----------------------------------------------------------------------------
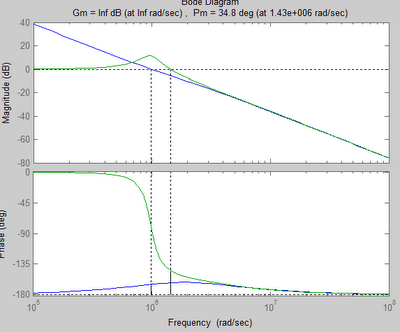
Here is the Matlab code for bode plot. It plots out both open loop & close loop response for comparison.
clc
clf
clear
num=1.61e12*poly( -1.37e6);
den=poly([0 0 -2.6e6]);
'G(s)'
G=tf(num,den) %open loop
T=feedback(G,1); %negative feedback 1 (close loop)
subplot(2,1,1)
margin(G)
%grid on
subplot(2,1,2)
margin(T)
%grid on
figure %create new figure
margin(G)
hold on %allow overlap
margin(T)
%grid on

No comments:
Post a Comment